Components
This page describes every moving part of MANA, what it is responsible for, and where it lives in the repository. For the big picture see the Architecture Overview; for how data moves between these components see Data Flow.
Component Map
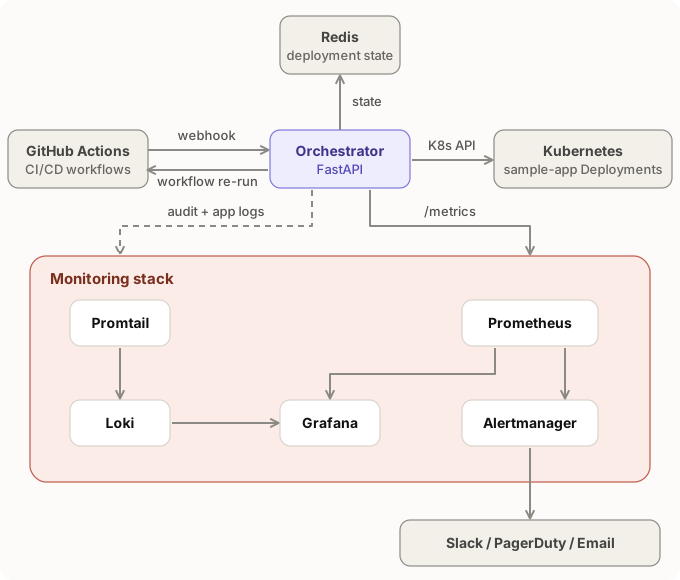
| Component | Path | Runtime | Role |
|---|---|---|---|
| Orchestrator | orchestrator/ |
Python 3.12, FastAPI | Receives deployment events, decides retry/rollback/alert, executes recovery |
| Redis | orchestrator/k8s/redis.yaml |
Redis 8 | Deployment state and last-known-good versions |
| Sample app | sample-app/ |
Python 3.12, Flask, Gunicorn | Deployment target with health probes, metrics and failure simulation |
| CI/CD workflows | .github/workflows/ |
GitHub Actions | Build, test, deploy, and notify the orchestrator |
| Terraform | terraform/ |
Terraform ≥ 1.5 | Provisions namespaces, apps, orchestrator, security and monitoring |
| Monitoring | monitoring/ |
Prometheus, Grafana, Loki, Promtail, Alertmanager | Metrics, dashboards, logs and alert routing |
| Scripts | scripts/, Makefile |
Bash, Make | Deployment automation and developer shortcuts |
Orchestrator
The orchestrator is the brain of MANA. It lives in orchestrator/src/ and is made up of four modules.
api.py: HTTP layer
A FastAPI application (src.api:app) that exposes the webhook receiver, manual operations, deployment queries and Prometheus metrics. It owns the Prometheus metric objects and translates orchestrator results into HTTP responses. At import time it constructs a single SelfHealingOrchestrator, so Redis and a Kubernetes config must be reachable when the module is imported; startup fails with a RuntimeError if either is unavailable.
See the API Reference for every endpoint.
orchestrator.py: decision engine and executors
SelfHealingOrchestrator combines the failure handler, health checker, rollback executor and state manager in one class.
| Method | Responsibility |
|---|---|
handle_deployment_failure() |
Increments the retry counter and chooses retry, rollback or alert |
calculate_backoff() |
initial_backoff × multiplier^(n-1), capped at max_backoff |
trigger_github_workflow_rerun() |
Waits for the backoff, then calls the GitHub "re-run workflow" API |
check_deployment_health() |
Polls until all replicas are ready and the app's health endpoint answers |
check_application_health() |
Calls GET http://<pod-ip>:<port><path> on each running pod |
get_previous_version() |
Finds the rollback target (Redis first, ReplicaSets as fallback) |
rollback_deployment() |
Patches the Deployment image tag and version labels, then verifies health |
save_deployment_state() / get_deployment_state() |
Persist and load DeploymentState as JSON |
save_successful_deployment_version() |
Records the last known-good version |
get_recent_deployments() |
Lists stored deployment states, newest first |
get_deployment_metrics() |
Reads replica counts and conditions from the Kubernetes Deployment |
cleanup_old_states() |
Deletes states older than N days (not scheduled automatically) |
The module also defines the domain types:
DeploymentStatus:pending,in_progress,success,failed,rolling_back,rolled_back,retry_scheduledFailureType:build_failure,test_failure,deployment_failure,health_check_failure,smoke_test_failure,timeoutDeploymentState: the record stored in Redis (see Data Flow)
config.py: configuration
OrchestratorConfig is a dataclass loaded from environment variables with from_env() and checked by validate(). get_config() returns a cached singleton. See Orchestrator Configuration.
utils/audit.py: audit trail
AuditLogger emits one structured JSON event per significant action (deployment_received, failure_detected, retry_initiated, rollback_initiated, rollback_completed, rollback_failed, rollback_skipped, health_check_*, state_saved, manual_intervention_required, and others). Every event carries a UTC timestamp, the deployment ID, namespace, version and a success flag. See Monitoring for how to query them.
Audit events and log formatting
Audit events are attached to the log record as extra={"audit_event": ...}. With the default logging.basicConfig format (%(asctime)s - %(name)s - %(levelname)s - %(message)s) only the AUDIT: <action> message line is printed. To get the full JSON payload into your log pipeline, use a JSON formatter that includes record extras.
Container and deployment
- Image:
orchestrator/Dockerfile(python:3.12-slim, non-root userorchestrator, UID 1000, serves on port 8000) - Kubernetes:
orchestrator/k8s/deployment.yamlcreates theorchestratornamespace, a 2-replica Deployment, aClusterIPService (orchestrator-service:8000), a ServiceAccount and a cluster-wide RBAC role - RBAC:
get/list/watch/update/patchondeploymentsandreplicasets;get/list/watchonpods;create/patchonevents
State Store (Redis)
Redis holds everything the orchestrator needs to make a stateful decision.
| Key | Value | TTL |
|---|---|---|
deployment:<deployment_id> |
JSON-encoded DeploymentState |
24 hours (refreshed on every save) |
last_successful:<namespace>:<app_name> |
Version string of the last successful deployment | none |
For local development, orchestrator/k8s/redis.yaml runs a single Redis pod with AOF enabled but an emptyDir volume, so state is lost if the pod is rescheduled. See Security and the Architecture Overview for production guidance.
Sample Application
sample-app/ is a small Flask service that exists to be deployed, broken and healed.
| Endpoint | Purpose |
|---|---|
GET /health |
Liveness probe. Always returns {"status": "healthy", ...} while the process is up. This is also the endpoint the orchestrator polls |
GET /ready |
Readiness probe. Returns 503 until STARTUP_TIME seconds have elapsed since start |
GET / |
Application info |
GET /api/data |
Sample data |
GET /api/stress |
Sleep and optional CPU burn (?duration=N&compute=true) |
GET /api/config |
Non-sensitive configuration |
GET /metrics |
Prometheus metrics (prometheus-flask-exporter) |
Supporting modules:
src/config.py: environment-driven, validated configuration (reference)src/utils/logger.py: JSON logging (in production) with per-request correlation IDssrc/utils/shutdown.py: SIGTERM/SIGINT handling that runs registered cleanup handlers before exit
Failure simulation. FAILURE_RATE (0.0 to 1.0) makes GET / and GET /api/data return HTTP 500 with that probability. It does not affect /health or /ready, so simulated failures show up in smoke tests and error-rate metrics, not in Kubernetes probes or the orchestrator's health check.
Kubernetes manifest (sample-app/k8s/deployment.yaml): 3 replicas, rolling update (maxSurge: 1, maxUnavailable: 1), non-root security context with all capabilities dropped, resource requests/limits, Prometheus scrape annotations, plus a Service, Ingress (sample-app.local), PodDisruptionBudget (minAvailable: 2) and HorizontalPodAutoscaler (3 to 10 replicas).
CI/CD Workflows
All workflows live in .github/workflows/. See CI/CD Integration for setup.
| Workflow | Trigger | Purpose |
|---|---|---|
main-pipeline.yml |
push (main, develop), PR to main, manual |
Entry point. Orchestrates the others |
build-and-test.yml |
called by main pipeline | Generates the version and deployment ID, runs lint and tests, builds and pushes images, notifies the orchestrator on build/test failure |
local-deployment-test.yml |
called by main pipeline | Deploys the new image to an ephemeral Kind cluster and runs health checks |
deploy-environment.yml |
called by main pipeline (manual dispatch only) | Deploys to staging or production with kubectl, runs health and smoke checks, then reports the result to the orchestrator |
security-scan.yml |
weekly, PRs, manual | Snyk dependency scan, Trivy image scan, Bandit code scan |
Terraform
terraform/ provisions the whole stack against whichever cluster ~/.kube/config points at.
| Module | Creates |
|---|---|
namespaces |
production, staging, canary, orchestrator, monitoring (each labelled name=<namespace>) |
sample-app |
Deployment, Service, Ingress, HPA and related resources for the sample app |
orchestrator |
ServiceAccount, ClusterRole/Binding, ConfigMap, Secret, Redis Deployment and Service, orchestrator Deployment |
security |
NetworkPolicies, ResourceQuotas and LimitRanges |
monitoring |
kube-prometheus-stack and loki-stack Helm releases, ServiceMonitors, PrometheusRules and the Grafana dashboard ConfigMap |
State is stored locally by default (backend.tf includes a commented S3 + DynamoDB example for production). Inputs are documented in the Configuration Reference.
Monitoring Stack
Configuration lives in monitoring/ and is consumed either by Docker Compose (local) or by the Terraform monitoring module (Kubernetes).
| Piece | Files | Notes |
|---|---|---|
| Prometheus | prometheus/prometheus.yml, alerts.yml, recording-rules.yml |
15 s scrape interval; pod discovery via prometheus.io/* annotations |
| Grafana | grafana/datasources.yml, dashboards.yml, dashboards/*.json |
Four dashboards: Self-Healing Overview, Deployment Metrics, Application Metrics, Infrastructure |
| Loki / Promtail | loki/loki-config.yml, promtail/promtail-config.yml |
Log aggregation from pods or containers |
| Alertmanager | alertmanager/alertmanager.yml, templates/ |
Severity-based routing to PagerDuty, Slack and email |
See Monitoring for metrics, queries and dashboard usage.
Scripts and Tooling
scripts/deploy.sh: end-to-end deployment (Terraform, images, Redis, orchestrator, sample app, monitoring, smoke tests)terraform/validate-terraform.sh: validates the Terraform modulesMakefile: shortcuts for build, test, deploy, port-forwarding, logs and cleanupdocker-compose.yml: local stack with Redis, sample app, orchestrator, Prometheus, Grafana, Loki and Promtail
See the CLI Reference.